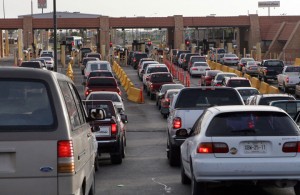
Long and unpredictable wait times at border ports are unproductive and cost the United States and Mexican governments billions of dollars a year, according to a report on the Mexico-U.S. border by an international border research partnership.
The report also calls into question the value of adding ever more law enforcement agents to combat illegal crossings, noting that the U.S.-Mexican border region is an “enormous geographical space,” much of it in remote terrain. Simply hiring more Border Patrol agents to address the problems is futile and unnecessarily expensive, the report says. For example, Border Patrol apprehensions of undocumented people were down significantly in 2012, while the numbers of agents continued to grow.
The report, released Friday in Washington, D.C., was compiled by the Woodrow Wilson Center for International Scholars’ Mexico Institute.
In 2008, according to the report, the economic impact of the delays caused by intense security at the border was about $5.8 billion, with an average waiting time of about 63 minutes. If current practices continue, the report estimated that major ports of entry, such as El Paso/Ciudad Juárez, would lose about $54 billion in economic activity by 2035, based on peak waiting times of three and a half hours.
“Overconcentration of resources at the border (and particularly between ports of entry) has the potential to distract from more strategic distribution,” said the report.
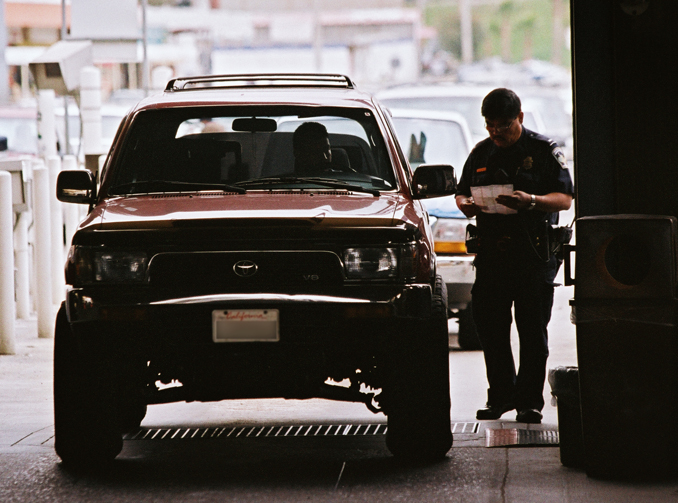
Border crossers experience long waiting times at U.S. port of entry in Hidalgo, Texas. CBP.gov
The report also asserts that although the number of Border Protection officers has increased, the agency seems to be “at or past a point of diminishing returns.” The number of officers doubled, to 21,000 by the 2011 fiscal year, up from about 10,000 in 2001, the report said. But during the same period, unauthorized immigration has actually dropped from its peak in the Southwest border sections, according to the report.
The report criticized the Department of Homeland Security for using the number of drugs, weapons and money seized to measure progress, rather than using security intelligence to assess the situation.
“Ultimately, the question is whether the border is the best place to stop these illegal flows or whether a strategic enforcement approach away from the border is more rational and cost effective,” it said.
Border security intelligence and investigation operations can focus on disrupting illegal traffic such as bulk cash or firearms, while staying away from the border, it said.
In previous years, the biggest concern was the possibility of terrorist groups entering through Mexico. Although the prevention of cross-border terrorism is a priority of border agents, other issues such as border violence, drug trafficking and illegal immigration have taken its place.
“Bottom line, the border security agenda has become less about national security and terrorist threats, and more about public safety,” the report said.
Now the concern is the drug-related violence that plagues the border region in Mexico, where drug cartels continue the fight for turf. Increased searching at the ports of entry also targets the traffic of drugs, money and weapons by cartels, it said.
The best way to combat trafficking is by increasing bi-national collaboration to implement a better justice system in Mexico, the report said. For the U.S., the report recommends diminishing the demand of illicit drugs by identifying and funding prevention and treatment programs and disrupting the firearm traffic from the U.S. to Mexico.
“Together, these challenges will require innovation and creativity amongst policymakers to ensure that the many competing interests and concerns that affect the border do not result in a region locked in inefficiency,” the report said.
The 174-page study was produced by the Border Research Partnership, comprising the Wilson Center, the North American Center for Transborder Studies and El Colegio de la Frontera Norte, a Mexican academic institution that studies border issues.
[chartboot version= ‘2.3’ code= ‘EEB8’ border= ‘0’ width= ‘778’ height= ‘620’ attribution= ‘0’ jsondesc= ‘{“containerId”:”visualizationEEB8″,”dataTable”:{“cols”:^{“id”:””,”label”:”Fiscal Year”,”pattern”:””,”type”:”string”},{“id”:””,”label”:”Coastal Border Sectors”,”pattern”:””,”type”:”number”},{“id”:””,”label”:”Northern Border Sectors”,”pattern”:””,”type”:”number”},{“id”:””,”label”:”Southwest Border Sectors”,”pattern”:””,”type”:”number”},{“id”:””,”label”:”Nationwide Total”,”pattern”:””,”type”:”number”}|,”rows”:^{“c”:^{“v”:”1993″,”f”:null},{“v”:131,”f”:null},{“v”:310,”f”:null},{“v”:3496,”f”:null},{“v”:4028,”f”:null}|},{“c”:^{“v”:”1994″,”f”:null},{“v”:119,”f”:null},{“v”:306,”f”:null},{“v”:3798,”f”:null},{“v”:4287,”f”:null}|},{“c”:^{“v”:”1995″,”f”:null},{“v”:106,”f”:null},{“v”:296,”f”:null},{“v”:4435,”f”:null},{“v”:4945,”f”:null}|},{“c”:^{“v”:”1996″,”f”:null},{“v”:117,”f”:null},{“v”:292,”f”:null},{“v”:5371,”f”:null},{“v”:5942,”f”:null}|},{“c”:^{“v”:”1997″,”f”:null},{“v”:123,”f”:null},{“v”:267,”f”:null},{“v”:6338,”f”:null},{“v”:6895,”f”:null}|},{“c”:^{“v”:”1998″,”f”:null},{“v”:135,”f”:null},{“v”:289,”f”:null},{“v”:7383,”f”:null},{“v”:7982,”f”:null}|},{“c”:^{“v”:”1999″,”f”:null},{“v”:130,”f”:null},{“v”:311,”f”:null},{“v”:7728,”f”:null},{“v”:8351,”f”:null}|},{“c”:^{“v”:”2000″,”f”:null},{“v”:133,”f”:null},{“v”:306,”f”:null},{“v”:8597,”f”:null},{“v”:9212,”f”:null}|},{“c”:^{“v”:”2001″,”f”:null},{“v”:136,”f”:null},{“v”:340,”f”:null},{“v”:9159,”f”:null},{“v”:9821,”f”:null}|},{“c”:^{“v”:”2002″,”f”:null},{“v”:132,”f”:null},{“v”:492,”f”:null},{“v”:9250,”f”:null},{“v”:10045,”f”:null}|},{“c”:^{“v”:”2003″,”f”:null},{“v”:145,”f”:null},{“v”:569,”f”:null},{“v”:9847,”f”:null},{“v”:10717,”f”:null}|},{“c”:^{“v”:”2004″,”f”:null},{“v”:155,”f”:null},{“v”:979,”f”:null},{“v”:9511,”f”:null},{“v”:10819,”f”:null}|},{“c”:^{“v”:”2005″,”f”:null},{“v”:160,”f”:null},{“v”:988,”f”:null},{“v”:9891,”f”:null},{“v”:11264,”f”:null}|},{“c”:^{“v”:”2006″,”f”:null},{“v”:153,”f”:null},{“v”:919,”f”:null},{“v”:11032,”f”:null},{“v”:12349,”f”:null}|},{“c”:^{“v”:”2007″,”f”:null},{“v”:172,”f”:null},{“v”:1098,”f”:null},{“v”:13297,”f”:null},{“v”:14923,”f”:null}|},{“c”:^{“v”:”2008″,”f”:null},{“v”:209,”f”:null},{“v”:1363,”f”:null},{“v”:15442,”f”:null},{“v”:17499,”f”:null}|},{“c”:^{“v”:”2009″,”f”:null},{“v”:223,”f”:null},{“v”:1887,”f”:null},{“v”:17408,”f”:null},{“v”:20119,”f”:null}|},{“c”:^{“v”:”2010″,”f”:null},{“v”:246,”f”:null},{“v”:2263,”f”:null},{“v”:17535,”f”:null},{“v”:20558,”f”:null}|},{“c”:^{“v”:”2011″,”f”:null},{“v”:232,”f”:null},{“v”:2237,”f”:null},{“v”:18506,”f”:null},{“v”:21444,”f”:null}|},{“c”:^{“v”:”2012″,”f”:null},{“v”:224,”f”:null},{“v”:2206,”f”:null},{“v”:18516,”f”:null},{“v”:21394,”f”:null}|}|,”p”:null},”options”:{“isStacked”:false,”animation”:{“duration”:500},”booleanRole”:”certainty”,”hAxis”:{“useFormatFromData”:true,”viewWindow”:{“max”:null,”min”:null},”minValue”:null,”maxValue”:null,”title”:”Border Agents”},”vAxes”:^{“useFormatFromData”:true,”minValue”:null,”maxValue”:null,”viewWindow”:null,”viewWindowMode”:null,”title”:”Fiscal Year”},{“useFormatFromData”:true}|,”legend”:”right”,”title”:”Border Patrol Agent Staffing by Fiscal Year”,”domainAxis”:{“direction”:-1},”series”:{“0”:{“color”:”#ff0000″},”1″:{“color”:”#0000ff”},”2″:{“color”:”#567E3A”},”3″:{“color”:”#DAA520″}}},”state”:{},”isDefaultVisualization”:true,”chartType”:”BarChart”}’ ]
[chartboot version= ‘2.3’ code= ‘1448’ border= ‘0’ width= ‘780’ height= ‘600’ attribution= ‘0’ jsondesc= ‘{“containerId”:”visualization1448″,”dataTable”:{“cols”:^{“id”:””,”label”:”Year”,”pattern”:””,”type”:”string”},{“id”:””,”label”:”Southwest Border Sectors”,”pattern”:””,”type”:”number”},{“id”:””,”label”:”Nationwide Totals”,”pattern”:””,”type”:”number”}|,”rows”:^{“c”:^{“v”:”1993″,”f”:null},{“v”:1212886,”f”:null},{“v”:1263490,”f”:null}|},{“c”:^{“v”:”1994″,”f”:null},{“v”:979101,”f”:null},{“v”:1031668,”f”:null}|},{“c”:^{“v”:”1995″,”f”:null},{“v”:1271390,”f”:null},{“v”:1324202,”f”:null}|},{“c”:^{“v”:”1996″,”f”:null},{“v”:1507020,”f”:null},{“v”:1549876,”f”:null}|},{“c”:^{“v”:”1997″,”f”:null},{“v”:1368707,”f”:null},{“v”:1412953,”f”:null}|},{“c”:^{“v”:”1998″,”f”:null},{“v”:1516680,”f”:null},{“v”:1555776,”f”:null}|},{“c”:^{“v”:”1999″,”f”:null},{“v”:1537000,”f”:null},{“v”:1579010,”f”:null}|},{“c”:^{“v”:”2000″,”f”:null},{“v”:1643679,”f”:null},{“v”:1676438,”f”:null}|},{“c”:^{“v”:”2001″,”f”:null},{“v”:1235718,”f”:null},{“v”:1266214,”f”:null}|},{“c”:^{“v”:”2002″,”f”:null},{“v”:929809,”f”:null},{“v”:955310,”f”:null}|},{“c”:^{“v”:”2003″,”f”:null},{“v”:905065,”f”:null},{“v”:931557,”f”:null}|},{“c”:^{“v”:”2004″,”f”:null},{“v”:1139282,”f”:null},{“v”:1160395,”f”:null}|},{“c”:^{“v”:”2005″,”f”:null},{“v”:1171396,”f”:null},{“v”:1189075,”f”:null}|},{“c”:^{“v”:”2006″,”f”:null},{“v”:1071972,”f”:null},{“v”:1089092,”f”:null}|},{“c”:^{“v”:”2007″,”f”:null},{“v”:858638,”f”:null},{“v”:876704,”f”:null}|},{“c”:^{“v”:”2008″,”f”:null},{“v”:705005,”f”:null},{“v”:723825,”f”:null}|},{“c”:^{“v”:”2009″,”f”:null},{“v”:540865,”f”:null},{“v”:556041,”f”:null}|},{“c”:^{“v”:”2010″,”f”:null},{“v”:447731,”f”:null},{“v”:463382,”f”:null}|},{“c”:^{“v”:”2011″,”f”:null},{“v”:327577,”f”:null},{“v”:340252,”f”:null}|},{“c”:^{“v”:”2012″,”f”:null},{“v”:356873,”f”:null},{“v”:364768,”f”:null}|}|,”p”:null},”options”:{“isStacked”:false,”animation”:{“duration”:500},”booleanRole”:”certainty”,”hAxis”:{“useFormatFromData”:true,”viewWindow”:{“max”:1750000,”min”:0},”minValue”:0,”maxValue”:1750000,”title”:”Apprehensions”,”viewWindowMode”:”explicit”,”gridlines”:{“count”:”6″},”minorGridlines”:{“count”:”2″}},”vAxes”:^{“useFormatFromData”:true,”minValue”:null,”maxValue”:null,”viewWindow”:null,”viewWindowMode”:null,”title”:”Fiscal Year”},{“useFormatFromData”:true}|,”legend”:”right”,”title”:”Apprehensions by Fiscal Year”,”domainAxis”:{“direction”:-1},”focusTarget”:”category”,”series”:{“0”:{“color”:”#f1c232″},”1″:{“color”:”#38761d”}}},”state”:{},”view”:{},”isDefaultVisualization”:true,”chartType”:”BarChart”}’ ]

 During the Institute, students are working journalists supervised by reporters and editors from The New York Times and The Boston Globe. Opportunities for students include reporting, copy editing, photography, Web production, print and Web design, and video journalism. Institute graduates now work at major news organizations, including The Associated Press, The Los Angeles Times, The Washington Post and The New York Times itself, and dozens of midsize news organizations.